How to Read a ZIP Code Page: What Every Number Means
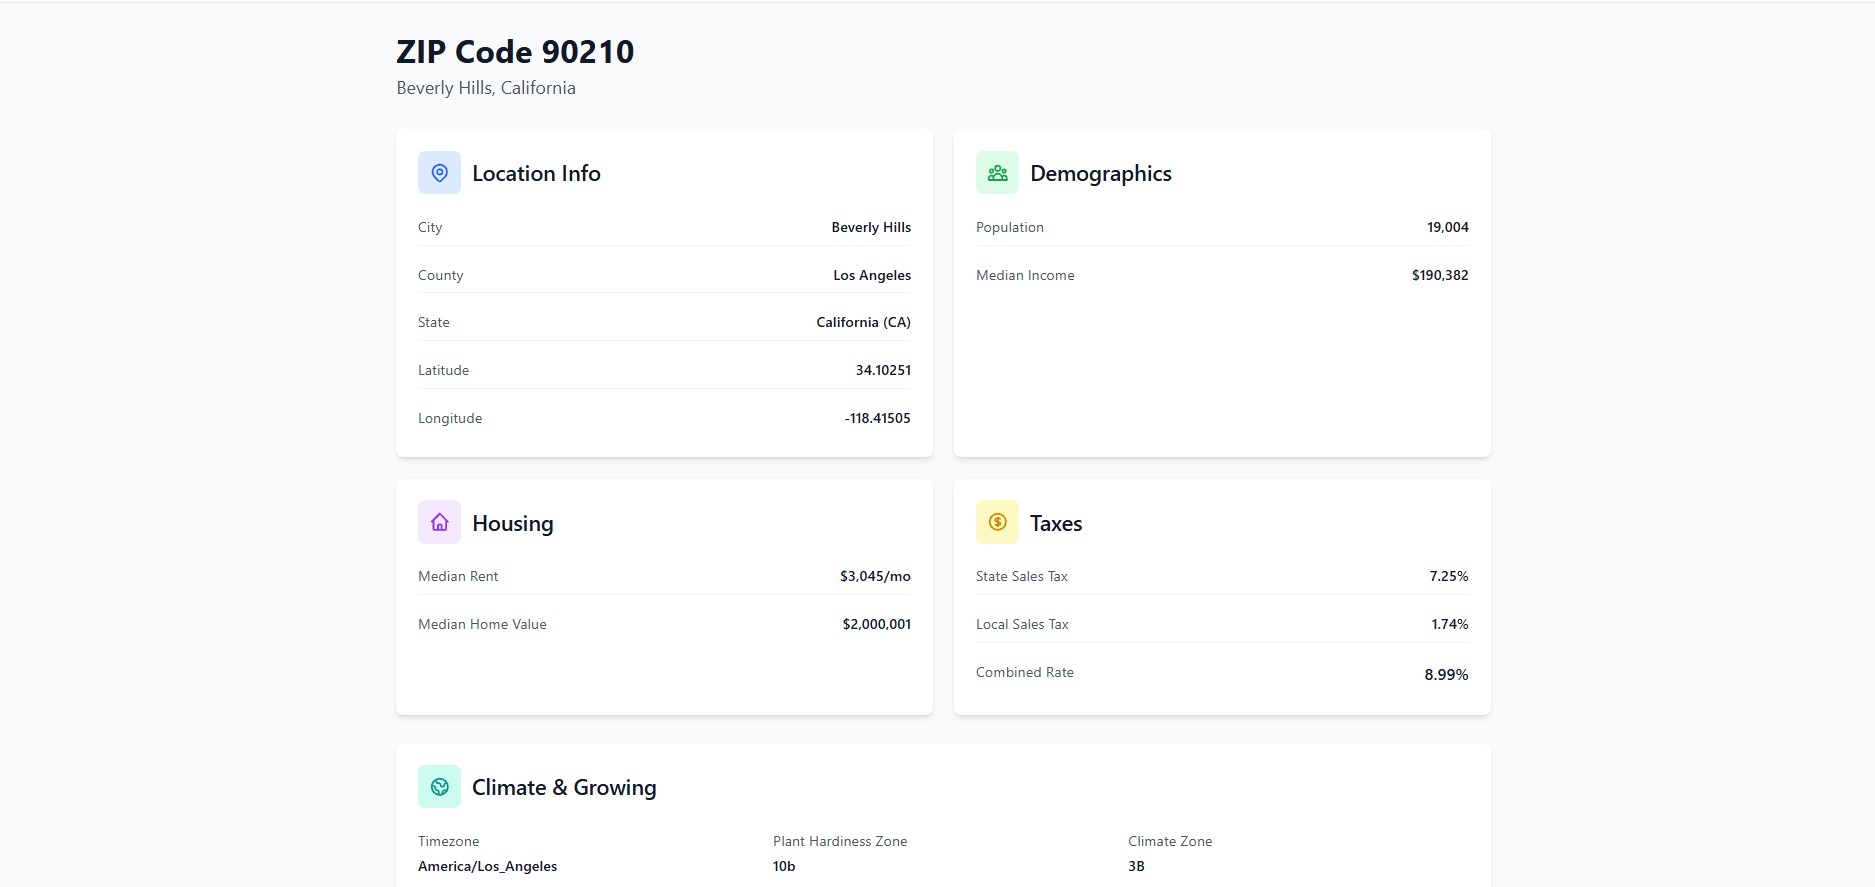
There are 41,552 ZIP codes in the United States.1 Each one on ZipCodePlus.com displays the same six data cards: Location, Demographics, Housing, Taxes, Climate, and Growing Zone. The numbers are consistent and comparable across every ZIP in the country, which makes them powerful for side-by-side research.
But only if you know how to read them.
This guide walks through each card, explains what the number actually measures, and shows you what to do with it. By the end, you will be able to open any ZIP code page and extract a clear picture of what it costs to live there, how cold it gets, and whether the neighborhood is economically stable.
Start with any ZIP code that interests you. Enter it at ZipCodePlus.com or browse by state — for example, browse all ZIP codes in Florida or browse all ZIP codes in Texas.
Card 1: Location
What it shows: City, county, state, latitude, longitude, timezone.
These look like administrative facts, but two of them carry real research weight.
County is the one most people overlook. In the United States, county governments control property tax assessments, school district funding, many public health services, and court systems. Two ZIP codes in the same city can sit in different counties and operate under completely different tax and school frameworks. When you see the county name on the location card, search it separately to understand the public services and school districts that apply.
Latitude gives you a quick climate preview before you even read the climate card. A ZIP code at 46 degrees north latitude (northern Michigan, for example) experiences winter fundamentally differently than one at 28 degrees north (South Florida). The higher the latitude, the more seasonal the climate.
Timezone matters for remote workers. If your team is headquartered in New York and you are considering a move to Arizona (which does not observe daylight saving time), that is a scheduling consideration worth knowing upfront.
Card 2: Demographics
What it shows: Population and median household income.
Population
Population tells you the density character of the ZIP code — whether you are looking at a dense urban neighborhood, a mid-density suburb, or a rural community. High-population ZIPs tend to mean more walkable amenities, more housing competition, and shorter distances to services. Low-population ZIPs typically mean more space, quieter surroundings, and more car dependency.
Median Household Income
This is the most information-dense number on the page. The median household income tells you the middle point of what households in this ZIP actually earn — half earn more, half earn less.
Compare it to the national median household income of approximately $83,700 (2024 Census data).2 A ZIP code significantly above that figure is generally a sign of high demand, stable property values, and well-funded local schools. A ZIP code significantly below it warrants a closer look at crime data and school ratings before committing.
The income-school connection is one of the strongest patterns in American real estate. Research from the National Association of Realtors found that homes in high-performing suburban school districts are priced 49% above the national median on average — a premium that reflects the demand for neighborhoods where school quality and income levels are high.3 The demographics card gives you the income signal; school research tools like GreatSchools.org give you the direct rating.
For deeper context on what these income figures mean across different states and regions, see Median Household Income by ZIP Code 2026 and What Is a Good Salary by State in 2026.
Card 3: Housing
What it shows: Median home value and median rent.
Median Home Value
The median home value is the midpoint price for homes in this ZIP — half are priced above it, half below. It is not an average (which can be skewed by a few very expensive properties), but a true middle figure.
Use this number three ways:
Against the national median. The U.S. national median home price in early 2026 is approximately $437,000.4 A ZIP with a median home value of $280,000 is meaningfully more affordable than the national norm. One at $750,000 is well above it. This comparison instantly tells you where a neighborhood sits in the national affordability landscape.
Against your buying budget. A rough way to calculate affordability: divide the median home value by 200 to estimate a monthly mortgage payment at current rates. If that number exceeds 30% of your gross monthly income, this ZIP is a stretch market for your budget.
Against the surrounding area. A ZIP code with a significantly lower median home value than neighboring ZIP codes is worth investigating — sometimes it reflects an up-and-coming neighborhood, sometimes it reflects something that makes it less desirable. Either way, it is a signal to look deeper.
Median Rent
Median rent tells you the going monthly rate for a typical rental unit in this ZIP. Divide the annual rent (monthly x 12) by the median household income. If that ratio exceeds 30%, the average household in this ZIP is spending more than the standard affordability threshold on rent — a rent-burdened area. That does not make it a bad place to live, but it tells you that if you are earning near the local median, housing will be tight.
For more on the rent versus buy decision, see Rent vs. Buy in 2026. For state-level rent context, see Average Rent by State 2026.
Card 4: Taxes
What it shows: State sales tax rate, local sales tax rate, combined rate.
The combined sales tax rate is the number that actually applies every time you buy groceries, clothing, electronics, or household goods. It is the state rate plus any city or county additions layered on top.
This number varies dramatically across the country. Several states — including New Hampshire, Oregon, Montana, and Delaware — have no sales tax at all. Parts of Illinois, Tennessee, and Louisiana carry combined rates above 10%.
On a household spending $40,000 per year on taxable purchases, the gap between a 0% rate and a 10% rate is $4,000 per year — real money that compounds every year you live in that ZIP code.
Two ZIP codes in the same state can have different combined rates because cities and counties set their own local additions on top of the state base. The taxes card shows you the exact combined rate for that specific ZIP, not just the statewide average.
For a full national comparison, see Sales Tax Rates by State 2026 and How Sales Tax Affects Your Cost of Living.
Card 5: Climate Zone (Koppen)
What it shows: The Koppen climate classification code for this ZIP code.
The Koppen system is the most widely used climate classification framework in the world. It assigns every location a two-or-three-letter code based on temperature patterns and precipitation. The first letter is the most important:
| First Letter | Climate Type | What Daily Life Looks Like |
|---|---|---|
| A | Tropical | No true winter; humid year-round |
| B | Arid | Dry; desert or steppe conditions |
| C | Temperate | Mild winters; four seasons without severe cold |
| D | Continental | Real winters; wide temperature range |
| E | Polar / Alpine | Severe cold; high elevation or far north |
If the first letter of your current ZIP and your target ZIP are different, you are making a genuine climate lifestyle change — not just a geographic one. Moving from C (temperate Pacific Coast) to D (continental Midwest) means budgeting for winter clothing, higher heating costs, and different seasonal rhythms. Moving from D (Northeast) to A (South Florida) means no winter but significantly higher humidity and hurricane risk.
The second and third letters add precision. An f means precipitation is distributed year-round. An s means dry summers (common on the Pacific Coast). The final letter — a, b, or c — indicates the intensity of the warmest season.
For a complete guide to reading these codes, see Climate Zones in the United States Explained and How to Use Climate Data When Choosing Where to Live.
Card 6: USDA Plant Hardiness Zone
What it shows: The USDA Plant Hardiness Zone for this ZIP code.
The USDA zone measures one specific thing: the average coldest temperature of the year over a 30-year period. It runs from Zone 1 (extreme cold, parts of Alaska) to Zone 13 (tropical, Hawaii and extreme South Florida). The 2023 update — the first revision since 2012 — incorporated data from over 13,400 weather stations.5
For gardeners, this tells you exactly what plants will survive your winters. For everyone else, it is a practical shorthand for how cold your winters actually get:
- Zones 3-4 (Minnesota, northern Maine): average extreme minimums of -30 to -20 degrees F. Serious winter infrastructure required.
- Zones 5-6 (most of the Midwest and Northeast): average extreme minimums of -20 to 0 degrees F. Standard cold-weather living.
- Zones 7-8 (mid-South, Pacific Northwest, North Carolina): average extreme minimums of 0 to 20 degrees F. Mild winters with occasional cold snaps.
- Zones 9-10 (Florida, coastal California, Texas Gulf Coast): average extreme minimums above 20 degrees F. Frost is rare or nonexistent.
A two-zone shift represents a meaningful change in winter experience, heating costs, and outdoor lifestyle. Use the USDA zone to ground-truth any climate assumptions you have about a destination ZIP code.
For more on this, see Understanding USDA Plant Hardiness Zones.
Reading Two ZIP Codes Side by Side
The most powerful use of ZipCodePlus is comparing two specific ZIP codes directly. Here is a quick example:
ZIP code 33139 in Miami Beach, Florida sits in Climate Zone Aw (tropical) and USDA Zone 11a. It has a high median home value and rent reflecting extreme coastal demand.
ZIP code 55401 in downtown Minneapolis, Minnesota sits in Climate Zone Dfb (continental, cold winters) and USDA Zone 4b. Its median home value is a fraction of Miami Beach’s.
The numbers tell the story immediately: two completely different climate commitments, two completely different housing price structures, and two sets of trade-offs a relocator needs to weigh honestly.
That is the point of the data. Not to tell you where to live — but to make sure the decision you make is fully informed.
Related Reading
- How to Research a Neighborhood Before You Move
- How to Research a ZIP Code Before You Move
- How to Compare Cost of Living Between Two Cities
- What Do the Numbers in a ZIP Code Mean?
- How to Use Climate Data When Choosing Where to Live
Sources
Page last updated: April 2026. Demographic data reflects U.S. Census Bureau American Community Survey estimates. Housing data reflects Redfin and Zillow market figures as of early 2026. Climate zone data sourced from NOAA and the 2023 USDA Plant Hardiness Zone Map.
Footnotes
-
USPS Postal Facts — ‘Number of ZIP Codes.’ United States Postal Service, July 2025. https://facts.usps.com/42000-zip-codes/ ↩
-
U.S. Census Bureau — American Community Survey 2024 5-year estimates, median household income. https://data.census.gov ↩
-
NFM Lending — ‘School Districts Impact on Home Values: What Every Buyer Should Know.’ https://nfmlending.com/financing-your-home/education/blog/school-district-home-values/ ↩
-
Redfin — ‘United States Housing Market and Prices,’ March 2026. https://www.redfin.com/us-housing-market ↩
-
USDA Agricultural Research Service — ‘USDA Unveils Updated Plant Hardiness Zone Map,’ November 2023. https://www.ars.usda.gov/news-events/news/research-news/2023/usda-unveils-updated-plant-hardiness-zone-map/ ↩